
How to Avoid Premature Entries (In Investing… and Otherwise)

Premature Decisions Are Rarely Justified
We’ve all seen what happens when someone acts too soon.
The CEO on the Coldplay kiss cam is a great example – not just because it made headlines, but because it reveals a deeper pattern: impulsive decision-making that starts long before the public fallout.
He didn’t just make a mistake at the concert. That moment was just the result.
The real mistake was likely made long ago, when he entered a relationship he wasn’t fully aligned with, or committed to something that didn’t truly fit his long-term values. If he had, he wouldn’t have been chasing a short-term thrill with a Memecoin-style fling.

The same thing happens in investing.
People make foundational decisions – what to buy, when to enter, how much to risk, not based on structure or clarity, but based on emotion, impatience, or the illusion of opportunity.
And like that CEO, they don’t realize it until it’s too late. Then they’re exposed, overextended, or stuck with the consequences.
Why So Many Investors Get In Too Early
Many people don’t lose money because they picked the wrong stock, crypto, or ETF.
They lose because they entered at the wrong time.
Premature entries often look like:
Buying too high because of fear of missing out
Jumping in before a correction completes
Reacting to hype, headlines, or social media
Ignoring their own criteria in favor of “gut feel”
Long-term investing starts with long-term thinking and crucially that means knowing when not to act.
What a Smart Entry Actually Looks Like

Smart investors wait.
They build systems. They set rules. They let the market come to them instead of chasing price.
That usually means:
Buying into value, not hype
Entering at key technical levels, not random peaks
Being clear about risk/reward
Using price structure and trend context to time accumulation
It’s not about getting the perfect bottom. It’s about entering when conditions support a solid, long-term thesis.
The best investment is one you're happy to hold – not one you're excited to chase.
Case Study: Solana Weekly Structure
Let’s look at the Solana Cryptocurrency as a prime example of entering near the top, why it is not optimal, and how to analyse price action for better potential entries.
Here, we see on the weekly chart, price reaching its prior ATH (All Time High) of 260 USD/SOL and surpassing it to reach just shy of 300 USD. Now, typically what can happen at these areas is there will be a test of liquidity - that is to say that potential buyers and sellers are looking to either enter long because they think price will continue on, or sell/short because they have bought lower and are looking to sell high and get a return on their investment.
Chart 1: Solana Weekly Rejection at Prior ATH
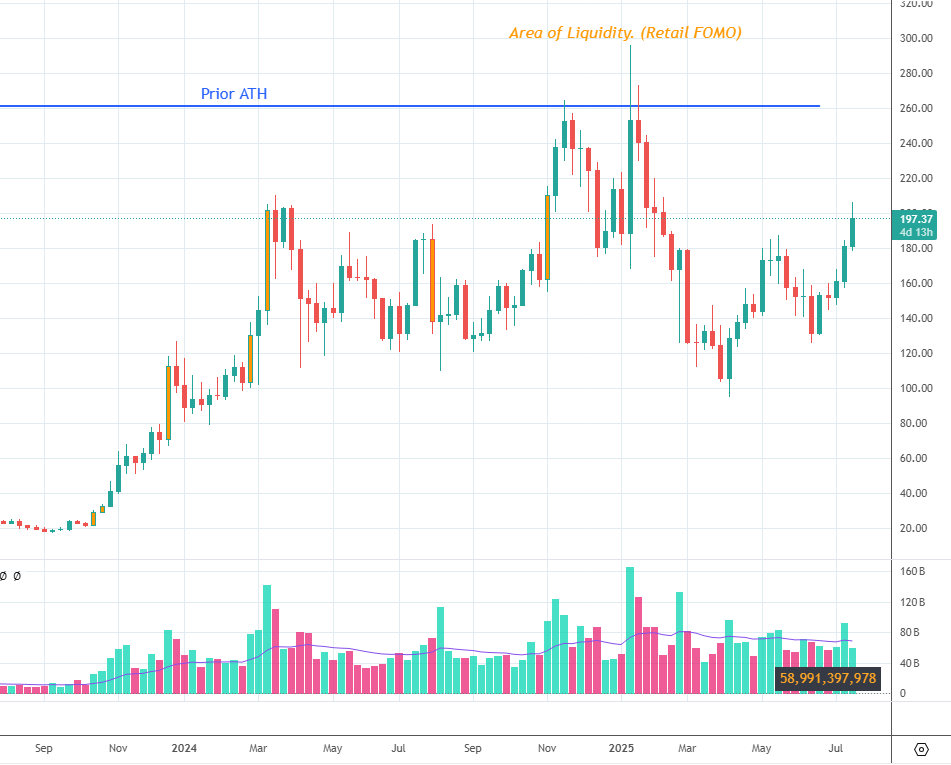
Area of Liquidity where retail FOMO often occurs near prior highs
[It should be stated that different traders and investors will enter for a multitude of reasons depending on their criteria, but from a longer-term perspective and for the purposes of this article we will stick with a more macro viewpoint.]
Now, for many retail investors, they often get caughtin the emotional side and see the price going up significantly and can make rash decisions based on FOMO (Fear of Missing Out). For this there are typically two scenarios - they bought lower and are on a high - they reason that they could have bought more at a lower price and assume that price will continue going higher, so strike again, make another entry at the top in the hopes of getting a bigger return. Or the second scenario, where you have those that did not even enter lower and get caught in the same emotional FOMO roller coaster.
So, what happened here and how do you make a better decision?
One crucial aspect is whether price is closing above the prior ATH. In this case it does not.
We see a liquidity grab and then price closes below the prior ATH. This is where the patient decision would have been to wait for price to close above the ATH, giving a stronger reason for trend continuation.
In the context of Solana already gaining a sizzling 1,277% in a little over a year (Oct 2023 to Jan 2025) it also shows that the market could be due for a pullback and needs some time to steam off.
Chart 2: Liquidity Grab / Failed Breakout
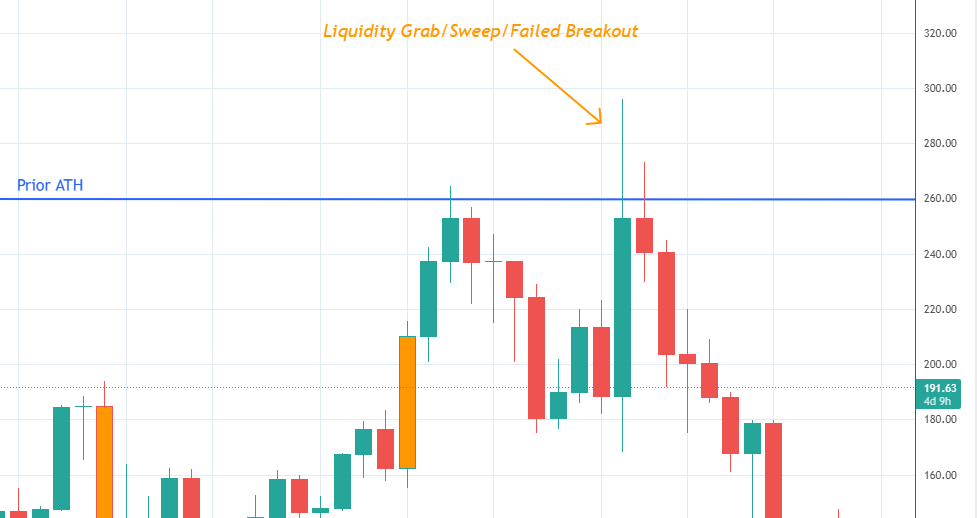
Zoomed-in weekly view showing a failed breakout followed by rejection - a classic liquidity grab
Delving a bit deeper, this is where volume analysis can give further information to help analyse and inform.
Looking at the volume bars we see price going up significantly from an opening weekly price of 188 USD to a closing weekly price of 253 USD with 160 Billion in volume. So that is a strong bullish candle on its own, however it is starting from a relatively lower price so uses up a lot of volume just to get back to where it was on the week of 18 Nov 2024.
Chart 3: Failed Breakout, Declining Volume and Exhaustion
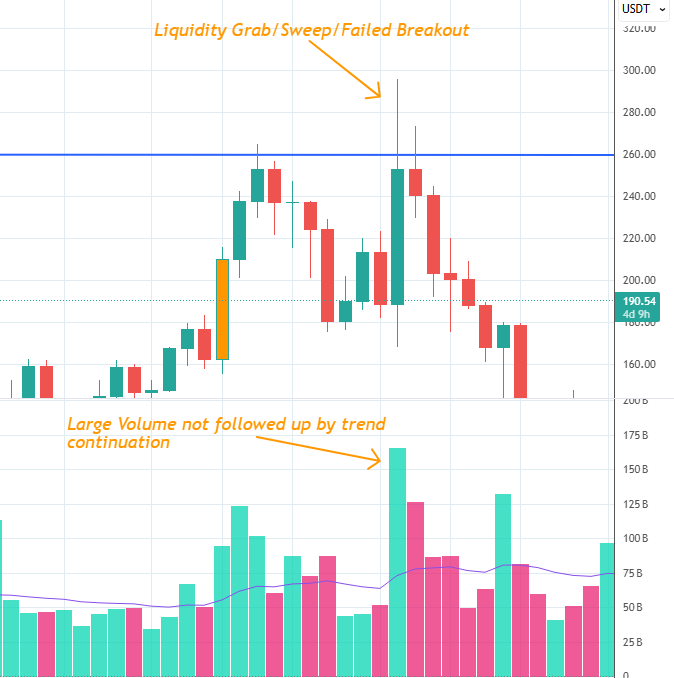
High timeframe support and resistance zones help define structured entry areas
Reasonably, it would mean that a continuation of vast volume in the hundreds of billions will be needed to sustain this momentum. This is where you exercise restraint and caution and wait to see if volume and price follow through - or not.
As can be seen there is a consistent decline in volume as price declines too - four consecutive candles and price is back to the 188 mark. That tells us that price was exhausted at that level and the correction needed.
Now, we see price correcting. The question is where is the next level of support, and crucially, will price respect it?
There are two significant high time frame levels to take note of. The first level is stronger and has more touch points from previous price history. We can see that price has respected it first as resistance, then as support many times, especially during the consolidation phase prior to the last pump.
Chart 4: Strong Weekly Support Zones
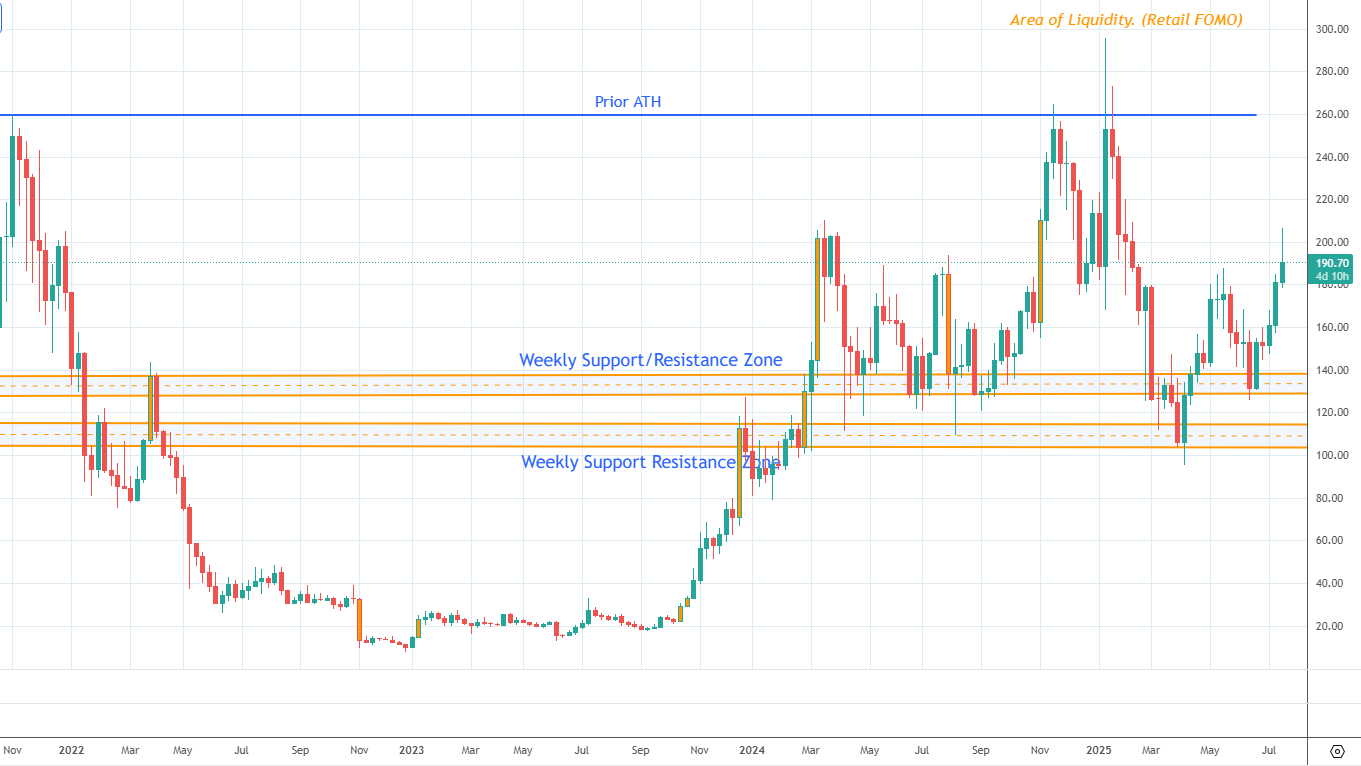
High timeframe support and resistance zones help define structured entry areas
The level below that is also a robust area of support. Now you have two significant levels marked off as levels to see if price sustains or not. If it does, this gives credence to getting a better entry - used in combination with a coherent strategy that has already been formulated. A better entry means you get in lower for bigger gains on your investment.
Chart 5: Two Clear Entry Options
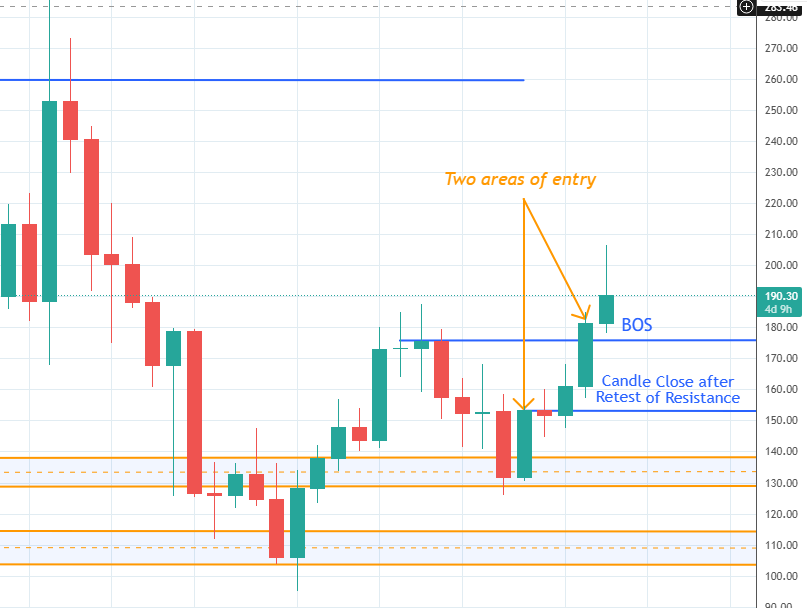
Hypothetical setup showing support holding and cleaner entry after confirmation
Here, you have a retest of the lower support/resistance level that lasts just one candle, before price moves back inside and then above the higher support/resistance zone. Shortly after, there's another retest of this higher area - again, only one candle closes below before reclaiming the level. This creates a first potential entry point, having confirmed two clean retests. That entry? Around the 150 USD mark.
Later, price forms a higher low, which is confirmed once the Break of Structure (BOS) is in place. A candle closes around 180 USD - still a far better entry than chasing it at 260 or 300 USD.

There are of course much more analyses that can be applied for making good and smart investment decisions on the markets, but using just these principles alone - namely understanding the basics of the technicals:
Liquidity
Volume
Support and Resistance
Price History
and respecting the psychological nature of emotions in investing - and how market makers operate within those dynamics will serve you well as you navigate the markets across your chosen assets.
Many investors jump in early during short-term pumps.
Those who waited for structure, higher timeframe confirmation, cleaner entries, and reduced risk are now sitting on better cost basis and peace of mind.
Patience is a position.
The Lesson: Don’t Let Emotion Lead Your Capital
The CEO chasing a short-term thrill wasn’t thinking about long-term consequences.
He acted on impulse - and paid the price.
Investors who jump into the markets the same way often get burned.
But those who act based on clear analysis, emotional control, and system-based entries?
They build wealth, not worry.
Build your system. Follow your structure. Invest with conviction.